A lot of contemporary businesses realize the importance of customer satisfaction, but get clueless when asked a single question, “So, how do you measure customer satisfaction?”
From what I’ve seen, customer satisfaction metrics are essential for answering this, but too often organizations treat feedback as scattered numbers instead of strategic insights.
Tracking survey scores, churn rates, or complaints in isolation doesn’t give leadership a complete picture of what truly drives loyalty and long-term growth.
In my view, meaningful progress only happens when businesses define the right metrics, interpret them with discipline, and connect them directly to measurable outcomes.
In this blog, I’ll explain the real value of measuring customer satisfaction and outline 10 key KPIs that every business should track to become genuinely customer-first.
What Is Customer Satisfaction?
Customer satisfaction refers to the degree to which a product or service meets or surpasses the customer’s expectations. It is a key indicator of consumer purchase intentions and loyalty.
High levels of customer satisfaction are often seen as a predictor of a company’s future success, as satisfied customers are more likely to return, make repeat purchases, and recommend the product or service to others.
Achieving and maintaining high customer satisfaction facilitates sustained business growth. It involves not only delivering quality products and services but also ensuring a positive overall customer experience. This can include everything from the initial marketing messages to the sales process, and post-sale customer support.
Companies often use various tools to measure customer satisfaction.
For instance, online survey software can help you design and share CSAT surveys with your audience in easy steps. Similarly, you can use help desk software to measure and track customer service satisfaction.
Watch this short video to learn more about help desk software and its features:
What Is a Customer Satisfaction Metric?
Customer satisfaction metrics reveal crucial data that helps you understand how delighted customers are with your products, services, or the overall business. In other words, they reveal the quality of a customer’s relationship with your brand and provide a clear framework for how to measure customer satisfaction in a structured way.
It must be noted that customer metrics reveal more than just numerical scores. They reveal the valuable opinions, attitudes, behavioral patterns, and feedback of your audience. Some examples of customer satisfaction KPIs include customer effort score (CES), Net Promoter Score (NPS), Customer Churn Rate (CCR), etc.
Although each and every metric has an important role to play, you need to ensure they align well with your business goals. For instance, if your goal is to create a simple and easy-to-use product, you can prioritize a metric such as the Customer Effort Score.
Why Do You Need to Measure Customer Satisfaction?
Customer satisfaction is no longer just a buzzword that brands use to attract customers. A great emphasis on customer satisfaction can give your business an edge over your competitors.
- Create the Right Culture of Communication & Feedback
Modern customers want to do business with a brand that values their opinions and is always striving to improve.
Monitoring customer satisfaction is a great way to keep customers engaged with your brand. It gives the message that your business is always open for communication and cares about the well-being of its customers.
Moreover, with the help of customer feedback, you can get a good idea about their preferences. For instance, if CSAT surveys reveal that customers are more satisfied watching online video tutorials compared to blogs, then you can focus on creating more such videos.
- Forecast Business Growth & Revenue
Happy and satisfied customers not just buy more but also act as brand ambassadors and recommend your products or services to others. In short, they do the job of your marketing team, and that too for free.
According to a study by Temkin Group, around 77% of customers would recommend a brand to a friend after having a single positive experience.
By adopting metrics such as the NPS, you can easily measure the likelihood of new and repeat business. You can identify the proportion of your customer base that is loyal to you and therefore, forecast cash flow, repeat purchases, referrals, and business growth.
- Spot At-Risk Customers
To build a thriving business, you would want your customers to stick around for long. But how do you know which customers will leave and which ones will stay?
With the help of metrics such as the Customer Health Score, you can easily identify your at-risk customers. Once identified, your customer success teams can focus their efforts on getting to the root cause of their issues and retain them.
Similarly, with the customer churn rate, you can measure your company’s loss in customers over a given period of time. You can understand why customers are leaving: Are they unhappy with the product prices? Are there any new competitors in the market who are able to grab their attention?
- Improve Product & Service Innovation
Customer satisfaction metrics not only show you how customers feel today but also help you prepare for tomorrow.
By analyzing survey feedback and effort scores, you can uncover common pain points, recurring issues, and requests for new features or improvements. These insights act as a direct input into your product roadmap and service enhancements.
This way, instead of guessing what customers want, your teams innovate based on evidence and deliver solutions that genuinely add value, improving overall satisfaction and loyalty.
To make things clearer, let’s dive deeper into the key metrics and explore practical customer service kpi examples that bring them to life.
10 Key Customer Satisfaction Metrics to Track This Year
Now it’s time to explore what metrics measure customer satisfaction. After some overwhelming research, I have handpicked the top 10 customer satisfaction KPIs that your team can target in 2026.
1. Net Promoter Score (NPS)
Net Promoter Score or NPS is one of the most popular metrics used to measure customer satisfaction. NPS is a customer loyalty measurement taken from asking customers one important question:
“How likely are you to recommend our business/product/service to others on a scale of 0-10?”
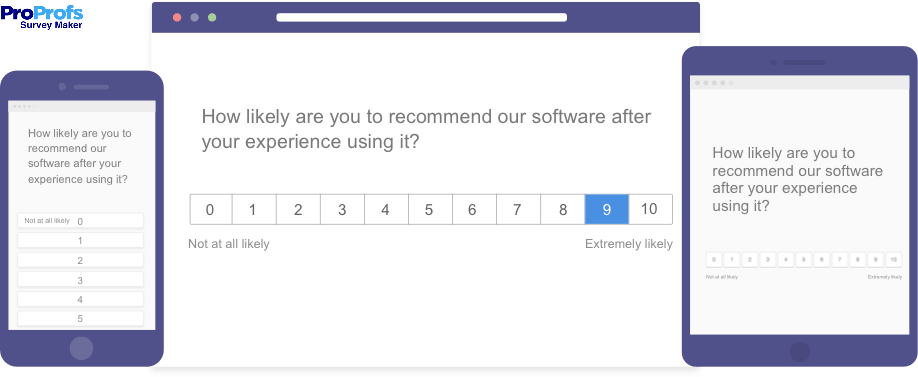
Over the course of time, NPS can help your business improve the customer experience and identify enthusiastic customers who can bring more customers through powerful recommendations. Now, let’s see how this metric really works.
How Does NPS Work?
To calculate NPS, you need to share an NPS survey that allows customers to choose a number from a rating scale of 0-10. Once you have collected all the responses, you need to divide them into promoters, passives, and detractors.
NPS Calculation Formula: NPS = % Promoters – % Detractors
- Promoters (score of 9 and 10): Promoters are your most loyal customers. They act as brand advocates and help your company’s growth by persuading their friends and family members to purchase from you.
- Detractors (score of 0 to 6): Detractors show the least likelihood of recommending your brand to others. They are the most difficult to retain and not just that; sometimes these customers can even drive potential customers away.
- Passives (score of 7 or 8): Passives usually hold a neutral stance. They are not as enthusiastic as promoters and are also unlikely to damage your brand’s reputation with negative word of mouth. However, with some great efforts, you can turn the passives into active promoters.
How to improve NPS?
Once you have analyzed your NPS results, the next step is to make the most of this information. Here are some strategies to gradually improve your NPS score:
- Act on customer feedback and communicate with your audience. Call them directly or share follow-up surveys to understand what really stops them from recommending your business to others. Additionally, consider using a social media scheduler to keep track of customer feedback and respond to it in a timely manner.
- Encourage your loyal customers to promote your brand offerings. For this, you can create loyalty programs or share referral bonuses with them.
- Share NPS surveys from time to time. Calculating the NPS customer satisfaction metric is not a one-time job. For in-depth analysis, you need to conduct such surveys in a periodic manner.
Quick Example:
Imagine an online subscription service sends out an NPS survey to 1,000 customers. Out of the responses, 600 rate the company 9 or 10 (Promoters), 250 give a score of 7 or 8 (Passives), and 150 rate it between 0 and 6 (Detractors). Using the formula, the NPS is (Promoters % – Detractors %) = (60% – 15%) = +45.
2. Customer Effort Score (CES)
Customer Effort Score or CES is another popular service metric that aims to measure the efforts put in by customers to interact with your products/services or business.
For instance, a customer might find it easier to contact the phone support team compared to finding a relevant help article from a poorly structured knowledge base. Similarly, you can think of other areas such as browsing online products or finalizing payments.
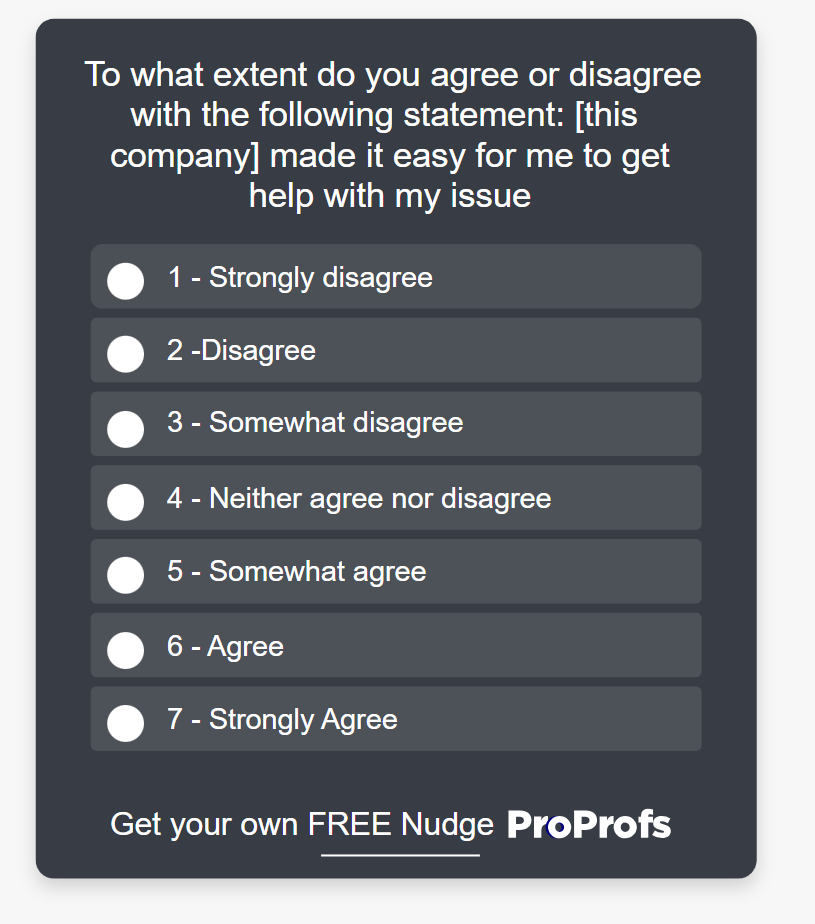
CES stands all the more important today as customers prefer to engage with brands that make their lives easier instead of adding to their long list of troubles and complications. In fact, the effort is a leading indicator of customer loyalty.
According to a Gartner study, consumers are 4 times more likely to become disloyal to a business after a difficult customer service experience.
Now, let us see how CES actually works.
How Does CES Work?
Once you have shared a CES survey with your customers, it’s time to analyze the results. Calculating CES is simple as you just need to average out the responses.
CES Calculation: Customer Effort Score = Sum of All Scores/Total Number of Respondents
Quick Example: An online retailer asks customers, “How easy was it to resolve your issue?” on a 1–7 scale. Out of 500 responses, the average CES is 5.8, showing most customers find support easy. However, the 10% scoring it low highlights friction points like long wait times.
3. Customer Satisfaction Score (CSAT)
Customer Satisfaction Score or CSAT is one of the top metrics to measure customer satisfaction. After all, we all have responded to surveys asking us about how satisfied we were with the food delivery, cab sharing experience, or other things.
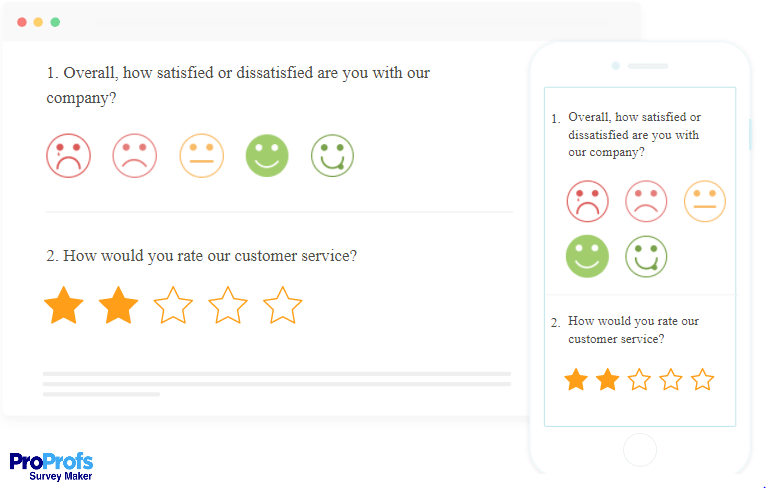
Over the years, the CSAT metric has gained popularity as every business wants to have more happy customers compared to unhappy customers.
According to the American Customer Satisfaction Index’s list of online retailers ranked by customer satisfaction, Chewy is the best with a score of 84, followed by Amazon (83).
There is no doubt that successful brands score high on customer satisfaction. Capturing customer feedback on existing products and services will help you fix improvement areas and become a truly customer-centric business.
How Does CSAT Work?
CSAT surveys usually give customers the option to rate their experience on a scale of 1-5. For calculating CSAT, we only consider responses of 4 (Satisfied) and 5 (Very Satisfied).
Here is the CSAT formula:

Quick Example:
Suppose your software company collects feedback after every support chat and gets 500 responses.
- 275 rated it 5 (Very Satisfied)
- 125 rated it 4 (Satisfied)
Using the formula:
CSAT (%) = (Number of satisfied customers ÷ Total responses) × 100
CSAT (%) = ((275 + 125) ÷ 500) × 100 = 80%Your CSAT score is 80%, meaning 8 out of 10 customers are happy with your support experience.
4. Customer Health Score (CHS)
While exploring customer satisfaction KPIs, you simply cannot ignore the Customer Health Score. CHS is a popular metric used by customer success teams to determine if customers are healthy (likely to stay) or at-risk (likely to churn). This helps you carefully segment your audience and bring the focus back to at-risk customers.
Customer success teams are often clueless – they are either spending more time on customers that will churn anyway or spending less time on high-value customers that demand consistently great experience.
According to a study, U.S. companies lose around $136.8 billion every year due to customer churn that is often avoidable.
Therefore, in such a scenario, the CHS can help you identify at-risk customers and resolve their pain points at the earliest before things start to turn ugly.
How Does CHS Work?
The purpose of CHS can differ from one company to another. For instance, one business might want to use the information to monitor the level of customer churn, while another might wish to gauge the success of upselling strategies.
Here are some top inputs to measure the customer health score:
- Product Usage: How frequently are people buying your products or services?
- Depth of Usage: How many product or service features are being used by customers?
- Breadth of Usage: How many users within a license are using this product/service?
- Growth of the Account: What is the percentage increase in the customers’ expenditure with your business?
- The Number of Customer Service Interactions: How often do customers feel the need to contact the support team?
To get a holistic view of your customers’ health, you can include as many elements as you want.
Quick Example: A SaaS company tracks CHS on a 0–100 scale. One client logs in daily, uses advanced features, pays invoices on time, and rarely raises support tickets. Their CHS is 85, signaling high loyalty. Another client logs in rarely, has unresolved tickets, and delayed payments—their CHS drops to 40, showing churn risk.
5. Customer Service Satisfaction (CSS)
Customer Service Satisfaction or CSS helps your business measure how satisfied customers are with your post-sales service. As an important indicator of customer satisfaction, this metric is calculated by sharing appropriate surveys with customers right after their support interaction.
Choosing the best help desk software can help you automate this process and share automated emails with attached surveys.

As more and more customers go for brands with exceptional customer service, measuring your customer service quality has become paramount.
According to research, 52% of customers have made an additional purchase from a business after just a single positive customer service experience.
In addition to online surveys, CSS questions can be shared using web forms, live chat, pop-ups, IVR, and other channels.
How Does CSS Work?
As discussed above, a CSS question is shared with customers allowing them to instantly rate your service (usually on a scale of 1-5).
CSS Score = Sum of All Ratings/Total Number of Respondents
Based on the ratings, you can measure the quality of a customer service interaction and even the performance of your agents. For instance, agents who receive top ratings can be rewarded with incentives or other benefits. On the other hand, agents with lower ratings can be trained accordingly.
Quick Example: After a support chat, a telecom company asks customers to rate their service on a 1–5 scale. Out of 1,000 responses, 720 rate it 4 or 5, giving a CSS score of 72%. This indicates most customers are satisfied, but the 28% lower ratings point to training or process improvements needed.
6. Customer Reviews
A customer review refers to subjective feedback by a customer who has purchased and used your product or service. You can find customer reviews on online stores, review sharing platforms, product comparison websites, social media channels, and more.
Customer reviews have become so powerful that they can determine the success or failure of your brand offerings. In fact, a majority of customers are actively scrolling through hundreds of reviews before they hit the ‘Buy Now’ button.
According to a study, around 93% of customers are influenced by online reviews when making a purchase decision.
Now, let’s see how online reviews actually work and how you can make the most of them.
How Do Online Reviews Work?
Let’s be honest. We all look for online reviews before buying anything online. A product may look really attractive in its images but reviews can convey a totally different story.
You need to encourage your happy customers to share their reviews online. This will help you leave a positive impression in the minds of your prospective customers and ensure they end up purchasing more.
Here is an example of an online review request email template:
Hi [Customer Name], We are glad to find that you are having a great experience with our [Mention Product/Service]. A lot of online visitors look forward to genuine user reviews to make the perfect buying decision. Would you please share your experiences with such customers by leaving a review for us on [Mention Review Site]? If you have any questions, feel free to contact me at any time. Thank you so much! [Signature] |
|---|
You will be surprised to know that a lot of customers who are happy with your business will be more than happy to share insightful reviews and recommend your brand to others. To encourage positive reviews, you can even share special discount coupons or other perks with such customers.
7. Customer Churn Rate (CCR)
The Customer Churn Rate also known as customer attrition refers to the percentage of customers who stop doing business with your company.
In business churn is inevitable. There will always be some customers who will eventually leave your brand. However, with the help of CCR, you can understand whether churn has reached an alarming rate or not.
While there can be more than a dozen causes of customer churn, there are some leading causes every business should be aware of.
According to Rentently, poor customer onboarding leads to 23% customer churn, compared to poor customer service, which amounts to 14% of customer churn.
By consistently measuring this metric, you can see what’s working and what’s not. Suppose you increase your product prices and see the CCR climb to more than 30%. This would mean that your business is losing customers due to high prices.
How Does CCR Work?
In order to calculate churn for a given time period, you must know the number of users at the beginning of the period and also the number of users at the end of the period.
Here is the CCR formula:

Quick Example:
Imagine a retail company that runs an online clothing store. At the beginning of the quarter, they have 5,000 active customers, but by the end, only 4,500 have made repeat purchases. Using the CCR formula, their churn rate is (5,000 – 4,500) / 5,000 = 10%.
When the team digs deeper, they find that most churned customers complained about delayed deliveries and inconsistent sizing. This insight helps the company take corrective steps—improving logistics, updating product descriptions, and offering size guides—to reduce churn and rebuild customer trust.
8. Abandonment Rate
Abandonment rate refers to the percentage of customers who terminated an interaction with your business before the desired action could be completed.
For example, for your call center team, the abandonment rate would be the percentage of customers who abandoned the call before being connected to a representative. Similarly, if you run an e-commerce business, the abandonment rate would be the percentage of customers who leave their shopping carts without making a purchase.
Abandonment rate is considered as one of the key customer satisfaction metrics because it shows how satisfied customers are with their interactions with your company.
For an online store, a low cart abandonment rate would mean that customers are having a smooth and hassle-free checkout experience.
How Does Abandonment Rate Work?
Abandonment rate determines the effectiveness of a customer’s interactions at various touchpoints. To calculate the abandonment rate, your business needs to keep a track of every customer interaction – both successful and failed ones.
Here is the abandonment rate formula:

Quick Example:
Let’s say a call center team of an MNC received 500 calls this month, and they handled 450 of them successfully. That would mean the call abandonment rate is 500 – 450/500 X 100 = 10%
9. First Response Time
First Response Time or FRT refers to the amount of time (minutes, hours, or days) taken by your team to respond to a customer issue or request. Now, you might wonder how does this metric even impact customer satisfaction.
Well, modern customers expect brands to respond to their queries at the earliest possible. Even a slight delay in response can add to their frustrations and hamper their experience.
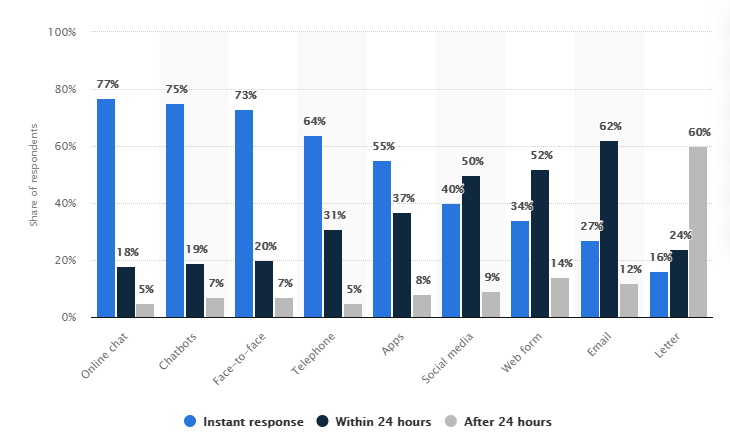
When it comes to getting a response from your business, customers have different expectations from different channels.
According to a Statista report, 77% of customers expect an instant response over live chat compared to 62% of customers who are fine with getting an email response within 24 hours.
Therefore, you need to reduce your average first response times to meet customer expectations and enhance customer satisfaction.
How Does FRT Work?
When your team receives few customer inquiries, calculating your first response time if fairly easy.
To calculate the average FRT, add up all your FRTs in a given period of time and divide it by the total number of resolved tickets in that time.
For example, let’s assume your team resolved 500 tickets in the month of May, and the total time taken for sharing the first response was 20,000 seconds
AFRT = 20,000 seconds ÷ 500 resolved tickets = 4000 seconds or 66.66 minutes
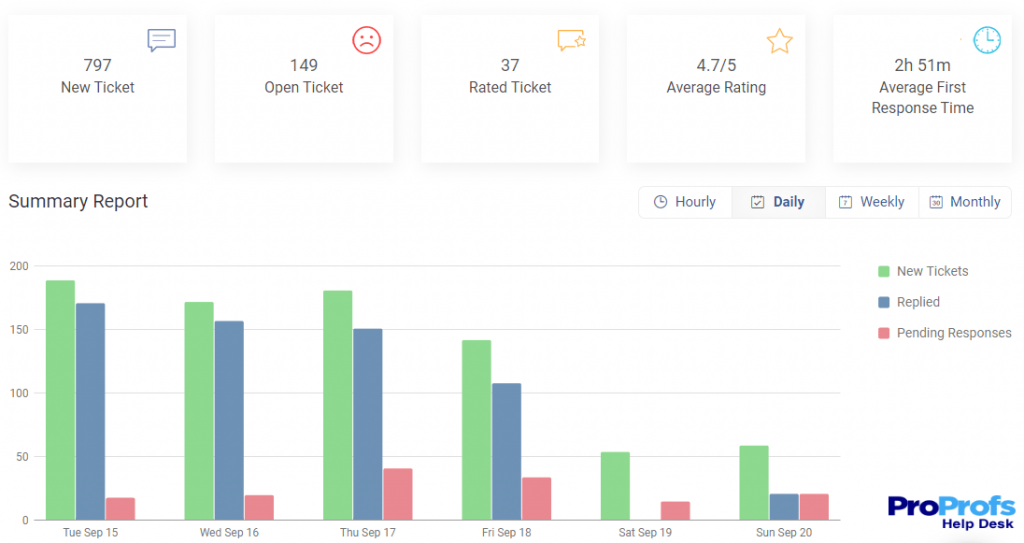
Now, things can get messy when your team handles thousands of tickets every month. In such a scenario, a help desk ticketing system can help you automate this process and view your team’s average first response time directly within customer service reports, giving managers a clear view of performance at a glance.
Quick Example:
A software company receives 1,200 support tickets in June. The total time taken by agents to send the first reply to all tickets is 48,000 minutes. By dividing 48,000 minutes by 1,200 tickets, the average first response time comes to 40 minutes. This means customers typically wait less than an hour to hear back from the support team.
10. First Contact Resolution
First Contact Resolution or FCR is another important metric for customer satisfaction. FCR simply refers to the percentage of tickets that are resolved by your team on the first interaction with the customer.
For phone calls or live chats, FCR means that the customer’s problem is resolved before they hang up the phone or terminate the chat session.
If customers have to contact your team multiple times to get a simple solution to their problem, then your business stands a great chance of losing the customer forever.
However, to avoid such a situation you can always look for strategies to improve your FCR. For instance, you can give your lower-tier agents enough knowledge and authority to resolve issues on their own without escalating cases to their seniors.
How Does FCR Work?
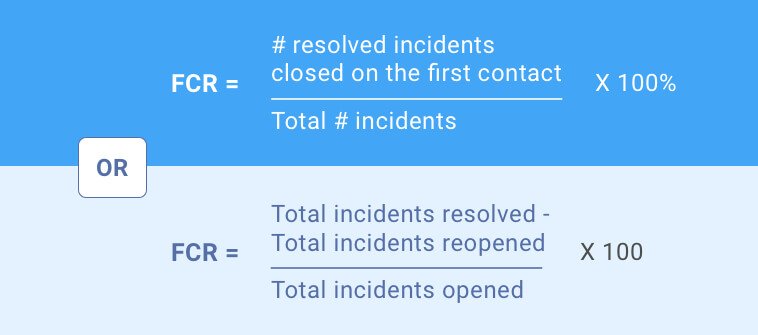
Calculating your FCR is simple as long as you know the number of issues you have resolved in the first interaction.
Here is the FCR formula:
Quick Example:
Take the telecom industry as an example. When a customer contacts support about network issues, resolving it during that first chat or call—without transferring to another department—counts as a successful FCR. If agents are trained with detailed troubleshooting scripts and real-time chat tools, customers leave the interaction satisfied, reducing repeat inquiries and improving overall service quality.
FREE. All Features. FOREVER!
Try our Forever FREE account with all premium features!
Get Closer to Your Audience With Customer Satisfaction Metrics
Measuring customer satisfaction isn’t just about tracking numbers—it’s about understanding what truly drives loyalty, retention, and long-term growth. The more consistent you are in monitoring the right KPIs, the better you’ll understand your customers’ needs and expectations.
By focusing on what types of metrics measure customer satisfaction, such as NPS, CSAT, CES, and CHS, you can pinpoint areas that need attention and make informed improvements.
Remember, the goal is not to measure everything, but to focus on the metrics that align with your business goals and deliver actionable insights. When used wisely, customer satisfaction metrics help you improve service quality, reduce churn, and build stronger customer relationships.If you’re looking for a reliable way to track, analyze, and act on these insights, tools like ProProfs Help Desk make it simple to manage customer interactions, automate reporting, and measure satisfaction in real time.
FREE. All Features. FOREVER!
Try our Forever FREE account with all premium features!


 We'd love your feedback!
 Thanks for your feedback!


